
The data challenge on labour productivity
ROGER HOSEIN
In order to comment on labour productivity and the allocation of scarce labour resources, one will need to calculate sectoral labour productivity. To do this, two sets of data are required.
One is on real GDP by sector following the ISIC (the UN's international standard industrial classification of all economic activities) revision four format, and the associated employed labour force, preferably for the most recent years so that emergent trends can be identified.
The challenge in such an undertaking is that the Continuous Sampling Survey of the Population (CSSP) data, the latest of which is 2016, although available by industrial classification, is not of the same ISIC revision four format as the real GDP data presented in the Review of the Economy, 2019.
As a consequence, researchers, policymakers, planners and other technocrats are unable to calculate the trends in labour productivity in the petroleum, agriculture, manufacturing and services sector. These types of data are critical as they help guide policymakers when making deep and important technical decisions.
To illustrate, suppose output per worker in the manufacturing sector is higher than output per worker in the make work programme sector (I am assuming in ISIC revision four that this is the other service activities sector) then it would be highly irrational for the State to facilitate an increase in number of workers in the other service activities at the expense of manufacturing.
The only way an academic or economist working in the government or elsewhere can examine such is to have access to timely data in the same format as relates to output and employment.
In the absence of this data there is information asymmetry and the politicians can increase employment in the make work sectors, as compared to manufacturing or highly productive sectors with serious long-term economic growth consequences. Let us assume, for example, that the manufacturing sector has a higher output per worker than the other service activities sector. Then, in economic language, expanding the other service activities sector at the expense of the manufacturing sector leads to a structural burden effect on the economy.
In the last few years, the Central Statistical Office (CSO) has not been up to date, as it should be, with its delivery of information into the public domain (I maintain, though, that the quality of information from the CSO remains of a very high standard). To bridge this timeliness gap, the government needs to improve on the funding of the CSO and accelerate the replacement of the CSO by the National Statistical Institute of TT (NSITT). The NISTT legislation is currently before a joint select committee, which is due to report back to Parliament by December 31. We hope that all is well, and it goes forward.
As it stands the facts are:
a) The last Annual Statistical Digest, which in my judgement is the flagship publication of the CSO, has not been published since 2010 and therefore pieces of information very pertinent to the national development process are no longer available, or only available in a very outdated format or in pockets online.
b) The published version of the CSSP, which is the “labour market data watchdog,” has not been published since 2009. While aspects of the 2017 data for the CSSP exist in a digital format, there are segments that still need to be sanitised (especially the data on mean and median income), and we are now going into 2020.
c) The business register has not been updated on a consistent basis for the past few years.
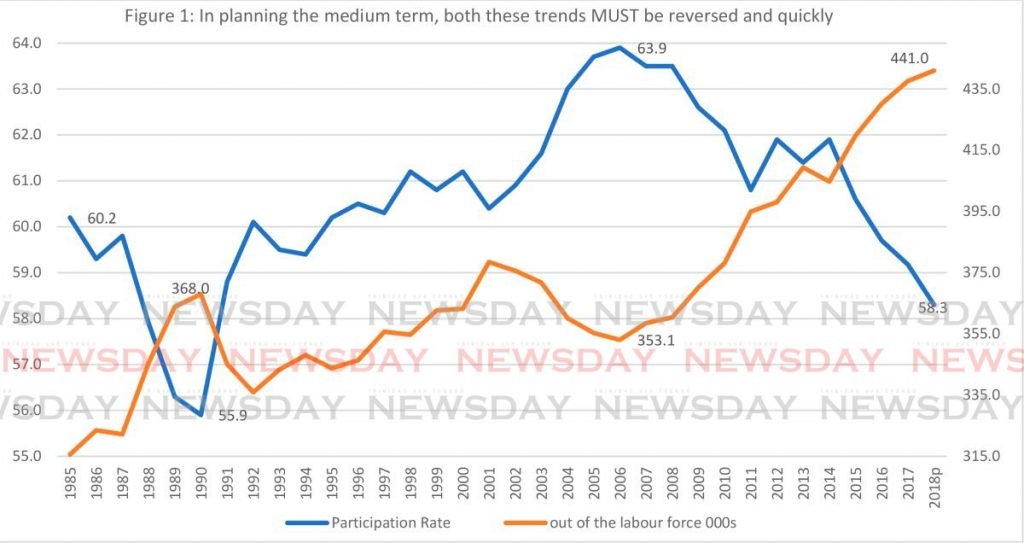
Consider the labour force participation rate shown in Figure 1 below. The labour force participation rate is at its lowest since 1993.
It’s a powerful variable that provides an indication of how much of the non-institutionalised population is willing and able to work. It has implications for the dependency ratio of the population and for social welfare planning.
It is possible that a falling labour force participation rate may be related to people joining gangs and other forms of criminal activities.
It would have been very useful to have this school dropout data to 2019 so that trends from 2014/15 to 2018/19 could be assessed.
Since 2014/15, the TT economy has decreased almost ten per cent in size, and this may also have implications for the dropout rates.
But without an adequate, up-to-date flow of information, we are at best guessing: not the best way to design policy nor the best way to help at-risk young people.Similarly, having up-to-date information on tertiary-education graduates who are unemployed can help policy-makers make judgements as to the effectiveness of the existing funding programmes, whether it should be more targeted and whether we are possibly over producing in some sectors, and may even raise issues as regards the funding strategy at work.
Note that in 2015 Moody’s credit rating agency downgraded the external credit rating of the TT economy and cited “inadequate provision of vital macroeconomic data” as one of its underlying reasons.
Note also that the IMF, in its Article 4 surveillance of the TT, economy noted, "Data provision has serious shortcomings that significantly hamper surveillance. IMF 2018, page six went on to note that, “Trade data is normally taken from the CSO, however, due to some consistency issues in the energy sector, trade data from 2011 onwards are CBTT estimates.”
These issues must be worked out, as energy-sector data is critical for understanding the real economic performance of the TT economy.
Comments
"The data challenge on labour productivity"